Services
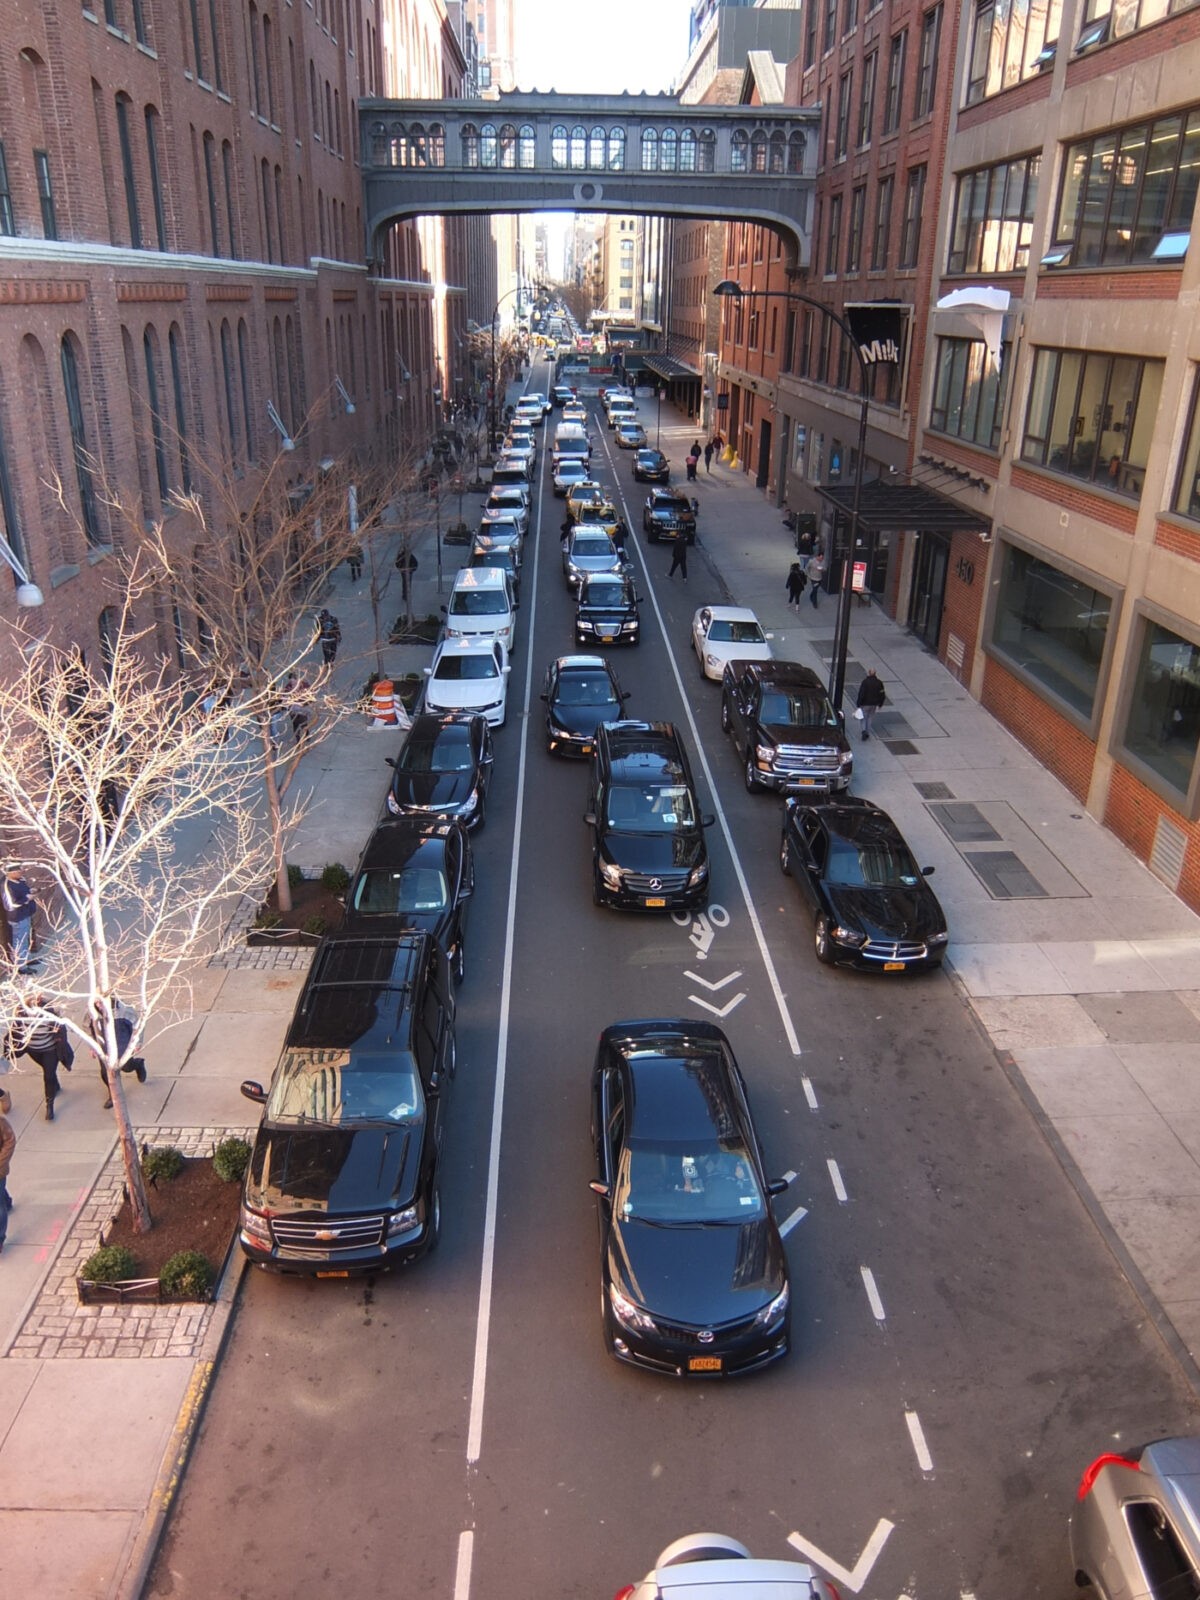
Expert Witness Testimony
High quality, well researched, expert opinion reports.
Human factors issues including expectation, cognition, conspicuity, vision, perception-reaction time, attention, memory, judgment and decision making, fatigue, and impairment.
Road safety issues including but not limited to speed, wayfinding, pavement markings, signage, and maintenance standards. These issues include:
• Visibility and how our visual system works in terms of detection, perception, and identification
• The importance of road users’ expectations
• Speeding/aggressive driving and its impact on collision risk
• Impairment
• Judgment and decision making
• Perception-response time
• Sightlines
• Signing and pavement markings
• Impact of driver age on behaviour and visual function
• Impact of lighting on nighttime perception
• Expected change in collision risk as a function of different roadway engineering designs
Road Safety Audits and Reviews
In Canada, road safety audits generally refer to assessments conducted during the design phase of a roadway, while in-service road safety reviews generally refer to the identification of improvements for a road that is already in use. See this list of road safety audit guidelines and prompt lists for additional information.

Human Factors and Road Safety Training
Our online human factors in road safety course covers human factors topics related to road safety including vision, information processing, intersection collisions, fatigue, distraction, and rail crossing behaviour. The course lessons can be customized to the particular needs of participants.
Assignments are are not part of this course, but participation in the discussion of the topics is required of all attendees. Only through engaged thought and deliberation will participants learn. There are no prerequisites or required texts for the course. Participants will be provided with an electronic PDF copy of the course slides for their personal use.
If you are interested in human factors training, please contact Maurice Masliah (mmasliah@headlightconsulting.ca). This is a new offering and dates for the course have not yet been set. For a syllabus of the course see the store.
If you have already created an account you can access it here.
Statistical Analysis of Collision Data
Development of safety performance functions, observational before and after studies, data visualization, and safety network screening.
WHAT DO WE MEAN BY HUMAN FACTORS?
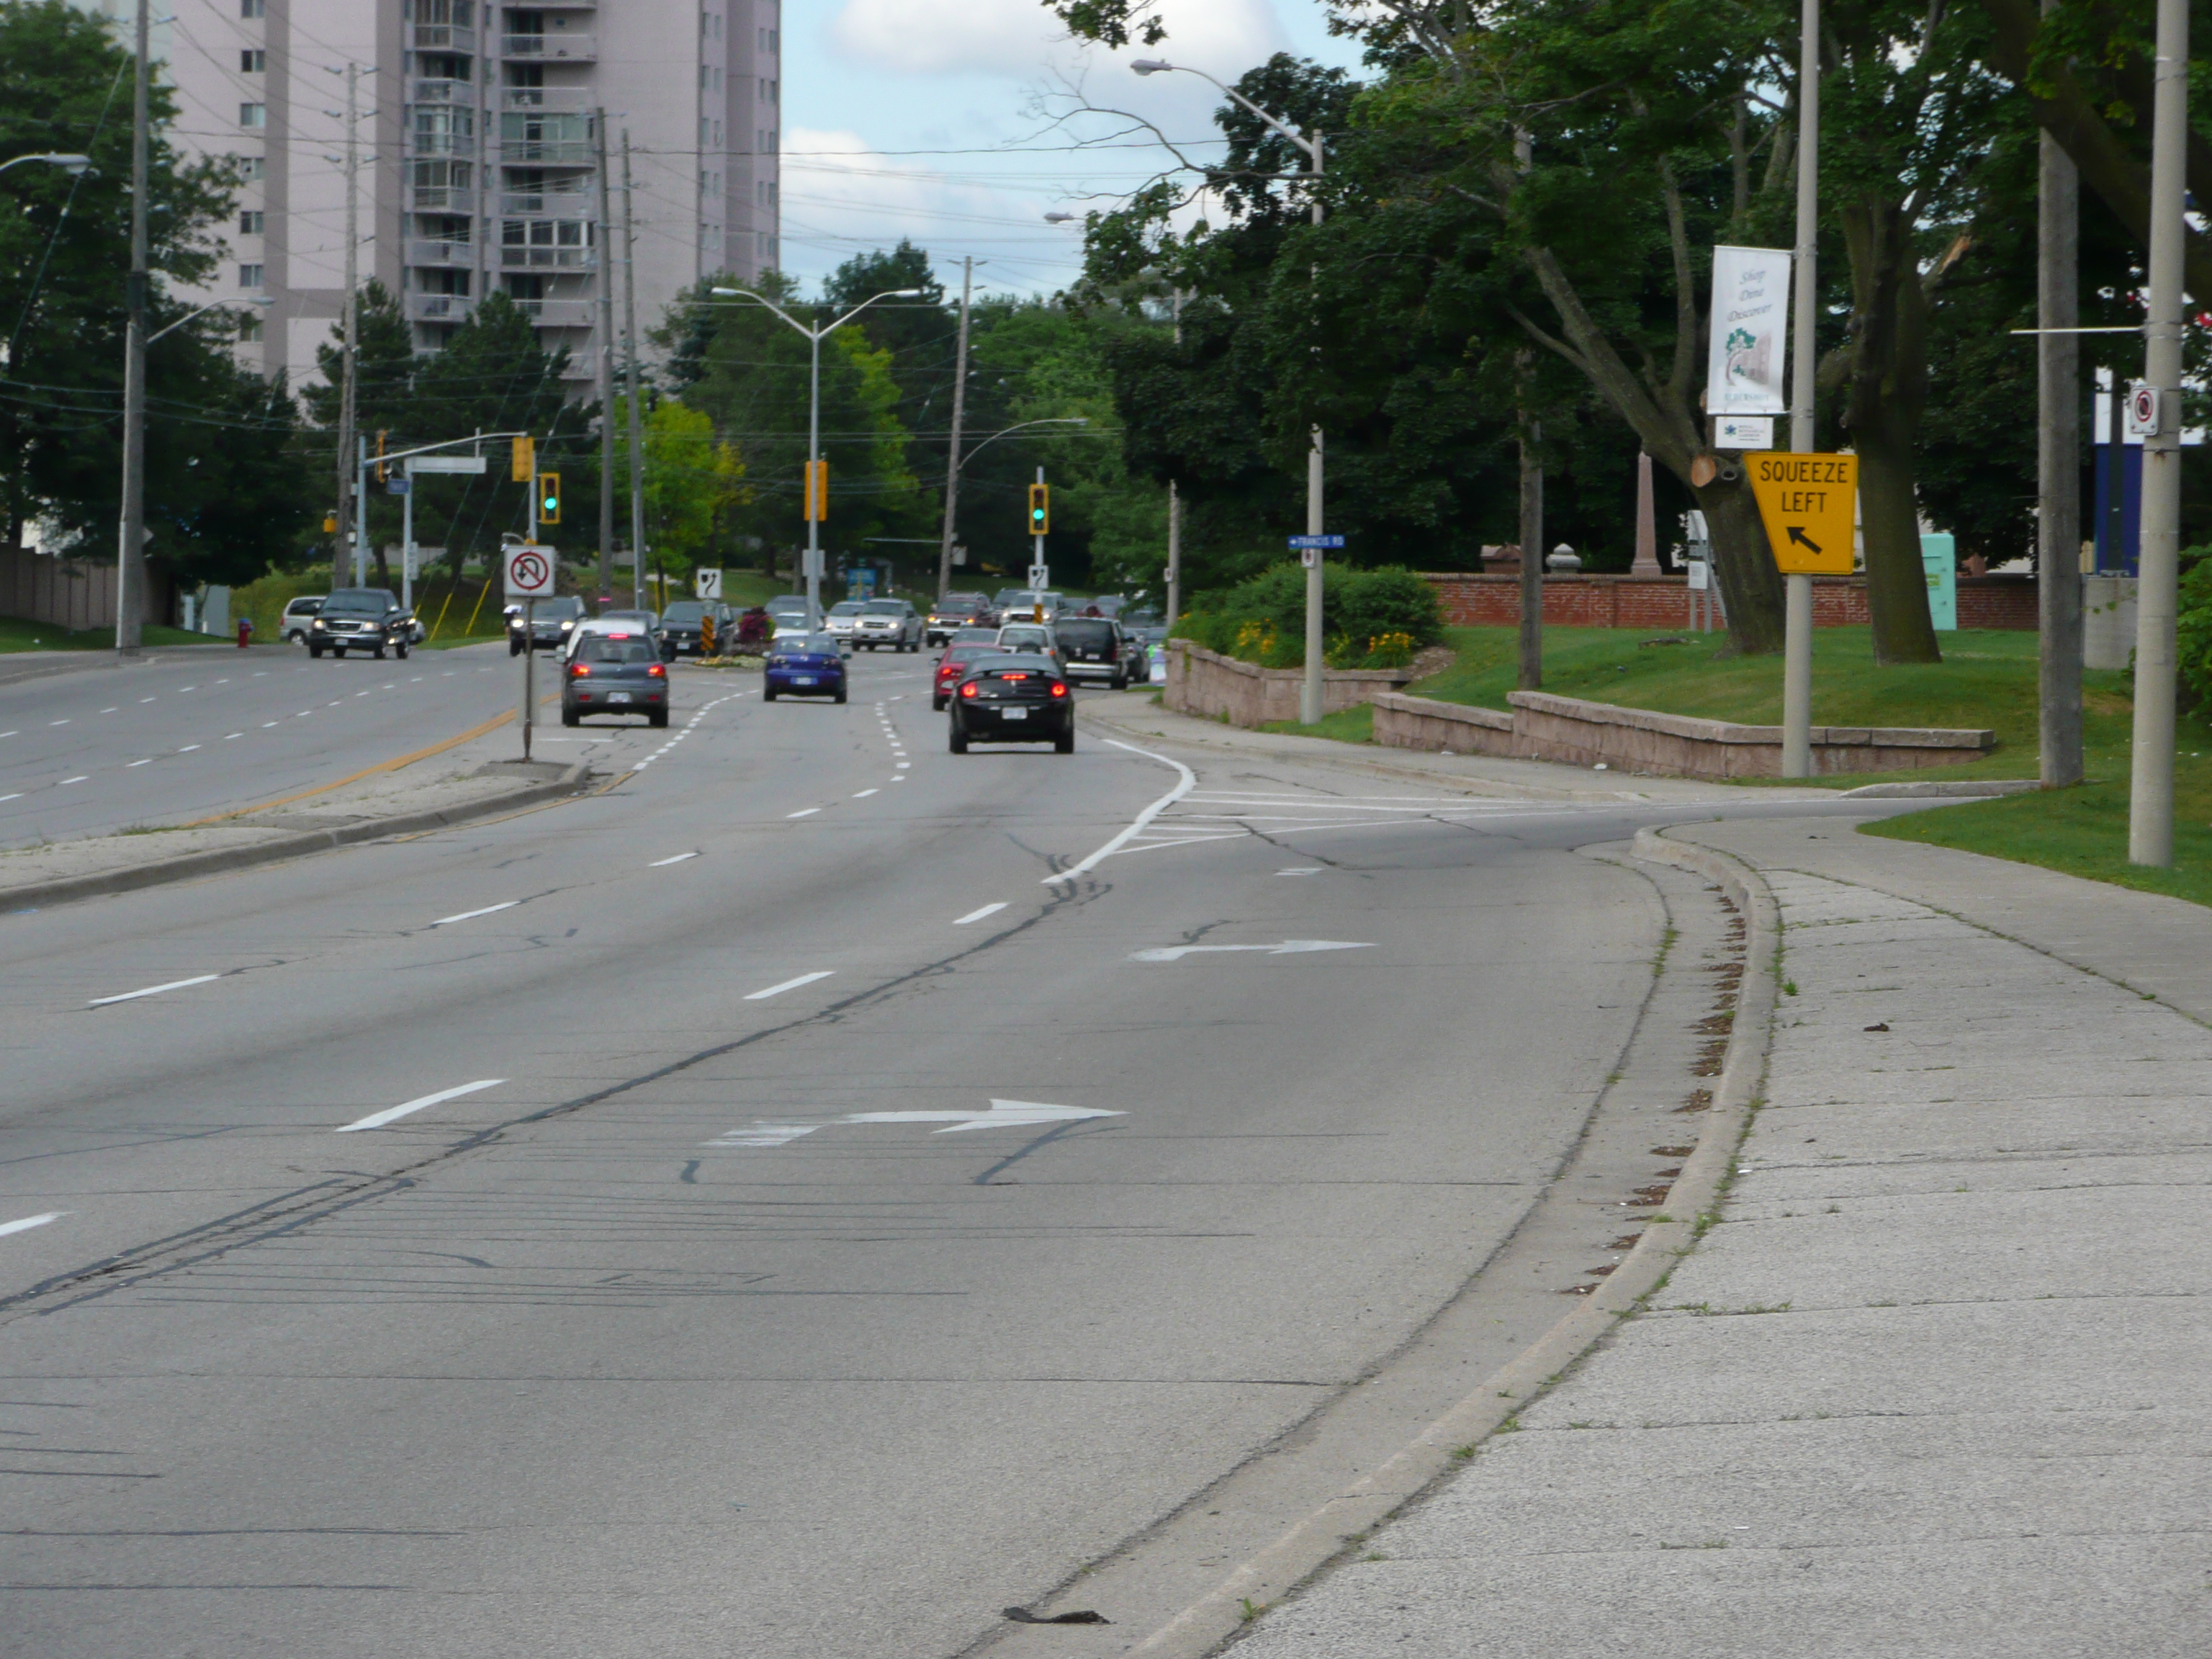
Engineers are usually concerned with designing something to meet certain specifications such as strength, size or speed. A computer scientist or programmer's primary task is typically to design software that generates the correct answer or operates something. The focus may not include the user interface. Human factors specialists, however, want to answer questions such as:
- First and foremost, is the product safe? Can it be made safer?
- Can the person use it? Will they want to use it? Will they use it again? How long does it take to learn to use it?
- How can the design be improved to make it easier or safer for the human user to achieve their goals?
And in terms of road safety, a human factors specialist wants answers to questions such as:
- Does the design meet road user expectations in terms of how the road will be used?
- Will road users know where to stop and how to cross the intersections?
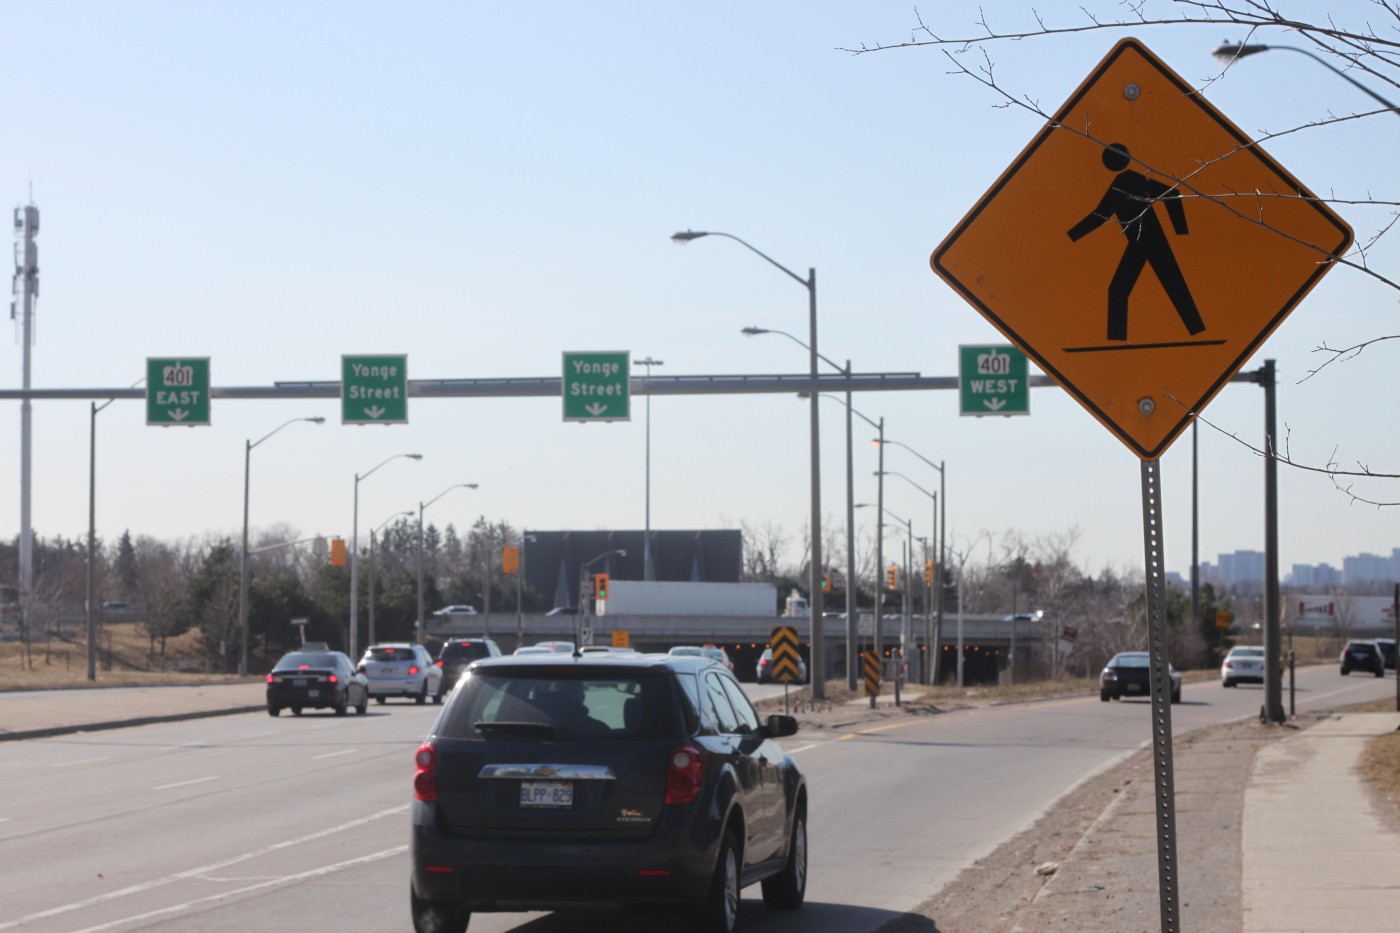
- Can road users see the signs in time so that they know where to stop, turn, or be on the lookout?

Definition of Human Factors
“Human factors is the scientific discipline that studies how people interact with devices, products, and systems. It is an applied field where behavioral science, engineering, and other disciplines come together to develop the principles that help assure that devices and systems are usable by the people who are meant to use them. The field approaches design with the “user” as its focal point. Human factors practitioners bring expert knowledge concerning the characteristics of human beings that are important for the design of devices and systems of many kinds. The discipline contributes to endeavors as complex as space exploration and to products as simple as a toothbrush. In the field of transportation engineering, there have been numerous important contributions from human factors, but these are not always self-evident. Sight distance requirements, workzone layouts, sign placement and spacing criteria, dimensions for road markings, color specifications, sign letter fonts and icons, signal timing – these and many more standards and practices have been shaped by human factors evaluation. As applied to highway safety, human factors is concerned with the design of the roadway and operating environment and the vehicle. The three primary components of the highway transportation system – the roadway, the vehicle, and the road user – all must be compatible with one another. Engineers can design roadways, traffic control devices, and vehicles, but they cannot design the road user. They can design for the road user. Human factors provides an objective basis for doing this. It is based on measured behavior and capabilities rather than assumptions or trial-and-error.”
Lerner, N.; Llaneras, R.; Smiley, A.; Hanscom, F. Comprehensive Human Factors Guidelines for Road Systems. National Cooperative Highway Research Program. Transportation Research Board of the National Academies. March 2005. Page B-4.
WHAT IS A SAFETY PERFORMANCE FUNCTION?
The number of collisions at a location, such as at an intersection, varies from year to year. While the number of collisions in any given year is random, the average number of collisions, over the long term, is the measure of safety of the location. To get to that long term average, we need many years of data. If 100 years of collision data at an intersection were available, we could calculate an average. Obviously, 100 years ago everything was very different. Traffic volumes and vehicles were different, and the intersection itself may or may not have existed. For a jurisdiction that has experienced rapid growth, an intersection may have been very different only a few years earlier. We may only have three to five years of usable collision data for a particular signalized intersection, but we may have three years of collision history for 100 other signalized intersections with similar characteristics.
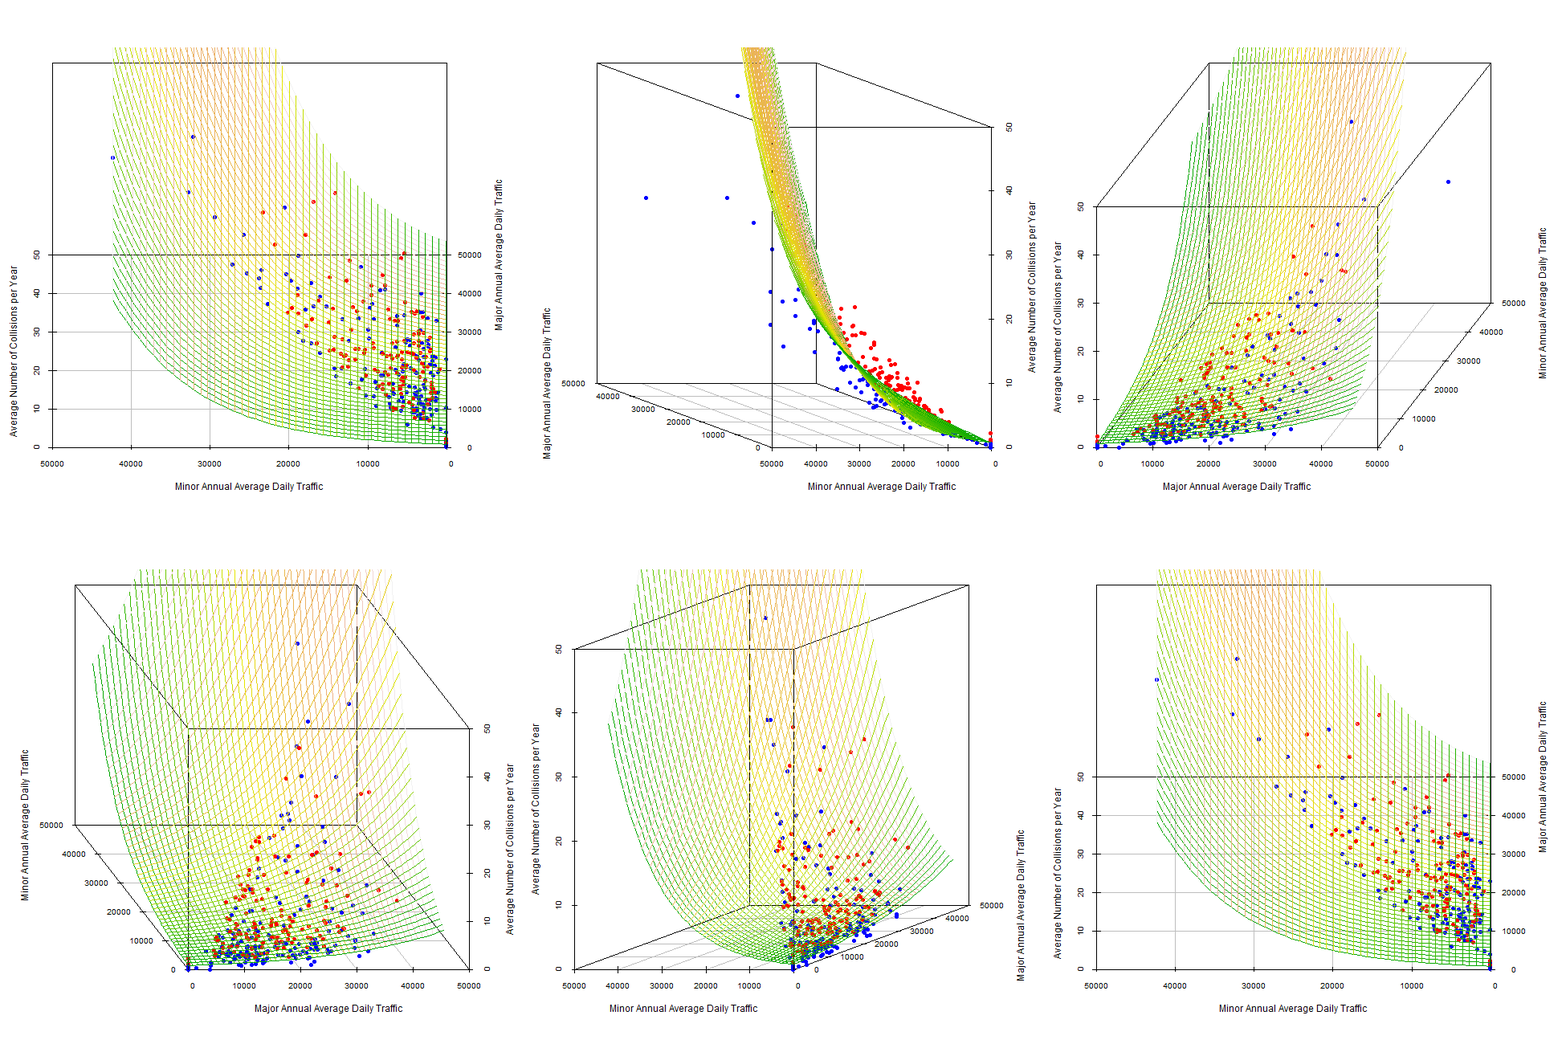
In the rotating graph above, each dot represents an individual signalized intersection each of which has different traffic volumes on the major and minor roads. On the third axis is the average number of collisions over three years. The curved grid surface represents the best fit equation that describes the relationship between the traffic volume and the number of collisions.
The mathematical equation that describes the shape of that surface is defined as a safety performance function. In the graph, intersections that are above the safety performance function are colour-coded red, and the intersections below the safety performance function colour-coded blue. The safety performance function is the start of the procedure known as safety network screening which is a formal way of ranking set of locations by their potential for safety improvement.

Headlight Consulting Inc.
107 Norton Ave
Toronto, Ontario M2N 4A4
Canada
Tel: 416-730-9744
Mobile: 647-701-9744

